
Figure 3.
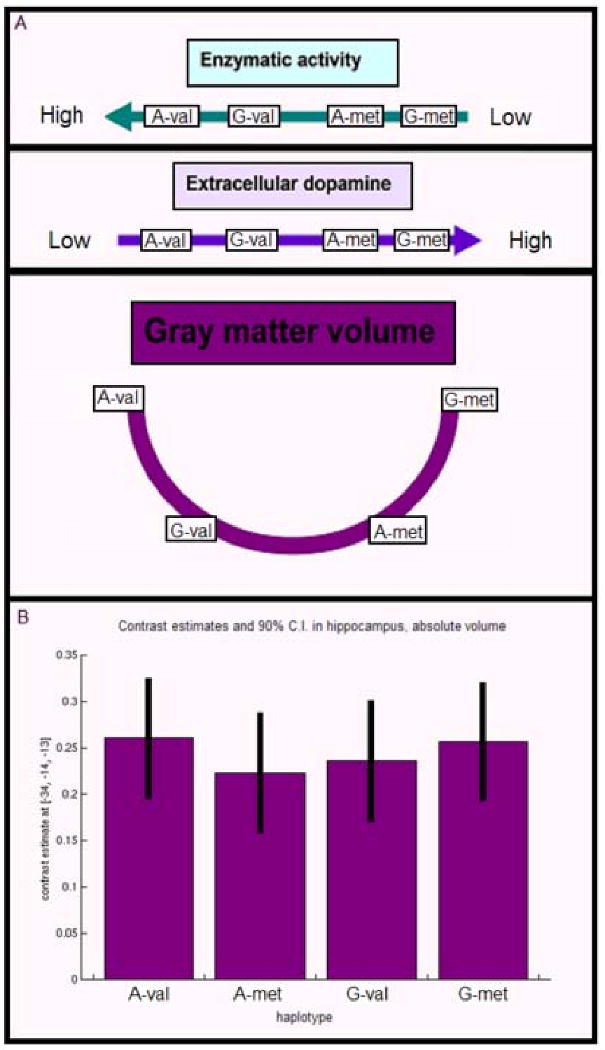
Figure 3 (B) demonstrates the trend for an effect of variation in the hippocampal ROI in the contrast of the P2-G allele & met-carriers (G-met) > P2-G allele & val-carriers (G-val). (A) When ordered by putative genetic variation of enzymatic activity, such that the highest activity was for A-val, then G-val (effect of reduced expression at promoter SNP in val-carriers), then A-met and finally G-met (corresponding to the met-carriers on each of the two P2 promoter backgrounds), a nonlinear U-shape relationship of haplotype effects was found in absolute hippocampal volumes, where both A-met and G-val were associated with lower volumes than A-val and G-met haplotypes