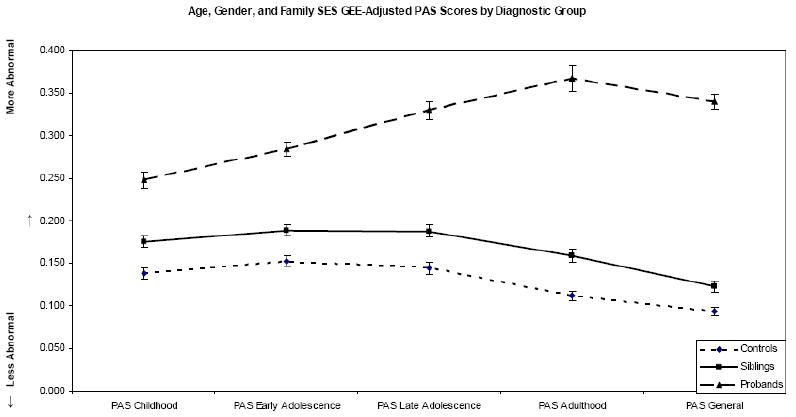
Figure 1.

Each line represents the GEE adjusted PAS subscores of controls, siblings, and patients with schizophrenia, respectively. In all cases, variance accounted for by age, gender, and family SES have been partialed out.

Each line represents the GEE adjusted PAS subscores of controls, siblings, and patients with schizophrenia, respectively. In all cases, variance accounted for by age, gender, and family SES have been partialed out.