
Fig. 2.
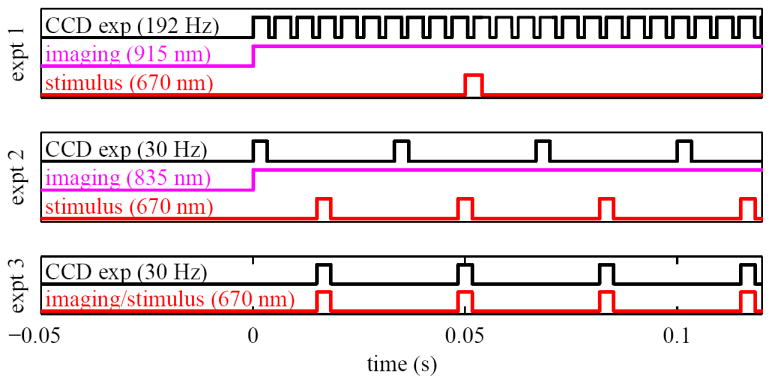
Timing diagrams for the experiments. The diagram for experiment 1 (top) shows a single visible stimulus pulse, CW near-infrared illumination for imaging, and the high-speed camera exposures. Experiment 2 (middle) shows CW near-infrared illumination for imaging along with interleaved stimulus pulses and camera exposures. Experiment 3 (bottom) shows a single visible source used as stimulus and illumination, synchronized with camera exposures.