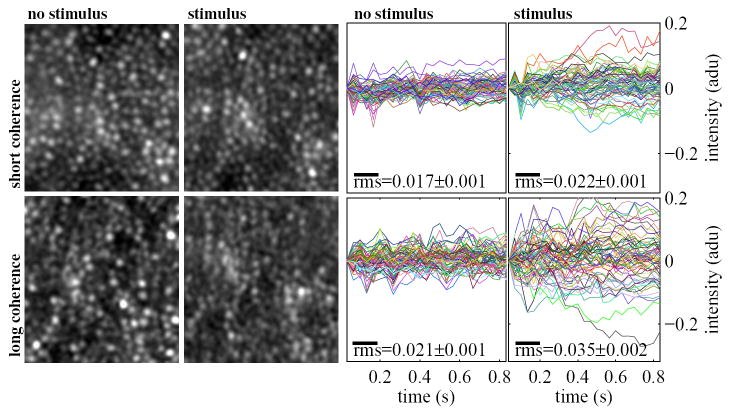
Fig. 8.
(Experiment 2) (left) Cone videos (30 Hz) of the same retinal patch under four different imaging conditions: short coherence and no stimulus (upper left), short coherence and stimulus (upper right), long coherence and no stimulus (lower left), and long coherence and stimulus (lower right). The long coherence/stimulus video shows the most scintillation–nearly every cone scintillates. A few cones appear to scintillate in the short coherence/stimulus case. The videos are .3 degrees in each dimension. (AVI video, figure_08.avi, 0.95 MBytes). (right) Reflectance plots of all of the cones (approx. 65 cones) in subregions of each video. Each cone’s reflectance is normalized to its initial reflectance. Shown on each plot is the mean time-RMS of the cones in that condition. Cones in the stimulus/long coherence condition have a mean time-RMS significantly higher than those in the other cases, and this is evident from the reflectance plots as well–the reflectances of these cones appear to spread out over time, owing to their random initial and final phases. Cones in the stimulus/short coherence condition have a mean time-RMS marginally higher than those in either unstimulated case.

