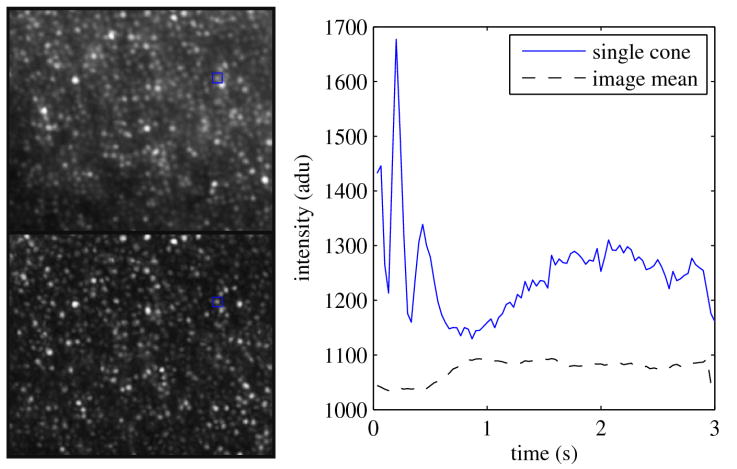
Fig. 9.
(Experiment 3) Cone imaging results using the same 670 nm laser diode (Lc=144 μm) to stimulate and image the retina over a 3 s duration. The top left image represents the registering and co-adding of 90 images acquired at 30 Hz of the same patch of retina. The bottom left image is the time-RMS across the same data set. The right plot traces the scintillation of a single cone (solid blue line) whose location in the cone mosaic (left) is indicated by the blue boxes. Also shown is the average intensity of the entire image (dashed line).

