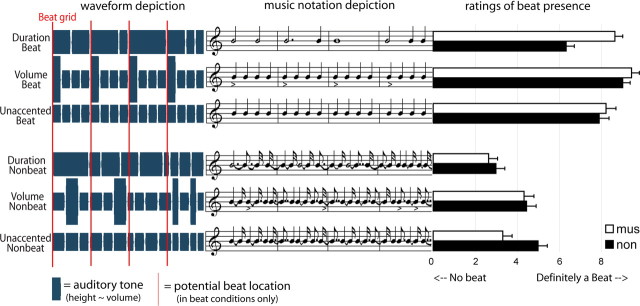
Figure 1.
Schematic depictions of the auditory stimuli used in experiments 1 and 2. On the left is a depiction of the auditory waveform, in the middle is a depiction in standard musical notation, and on the right are the mean ratings of beat presence given by participants for each condition (mus, musician; non, nonmusicians). Red lines mark the onsets coinciding with the beat (applicable to beat conditions only) and correspond to the first note of each measure in the music. Volume accents are indicated by higher relative height (in left) or accent symbols (< in the right). The depictions represent an excerpt of ∼2.5 s.

