
Figure 2.
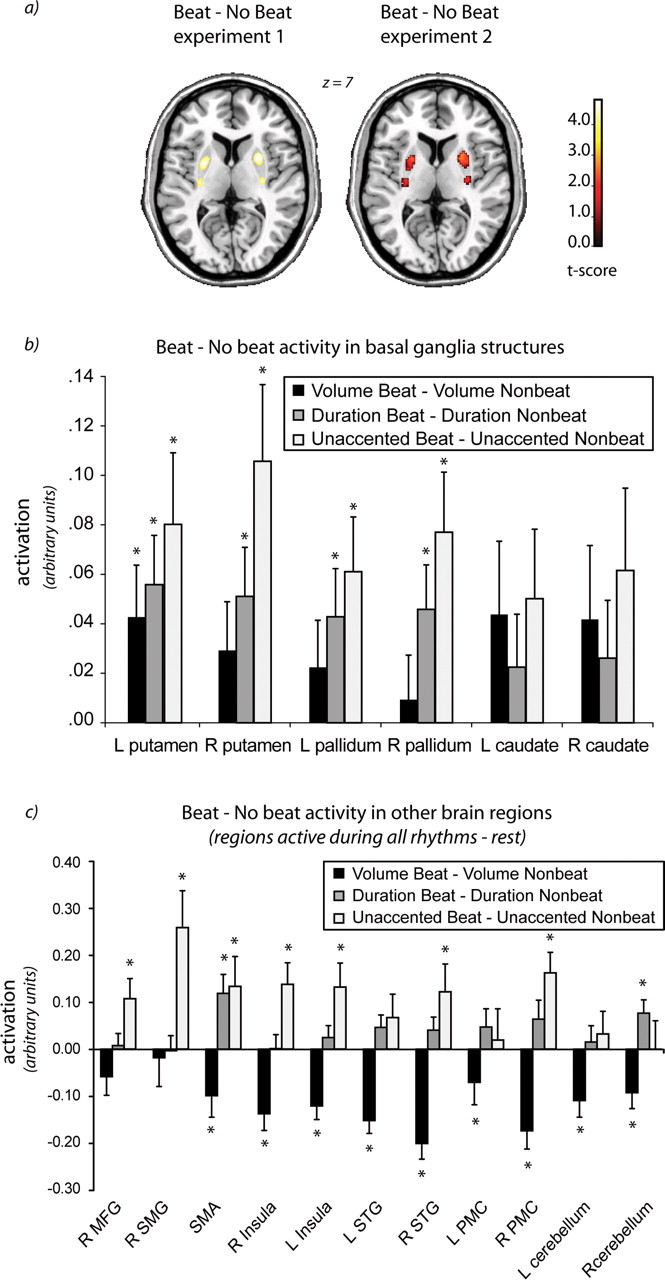
Statistical parametric mapping (SPM) analyses. The beat versus nonbeat contrasts overlaid on a template brain (a) and as extractions from regions of interest (b, c). Beat versus nonbeat SPM contrasts for experiment 1 and experiment 2 (for experiment 2, activation is masked by same contrast from experiment 1). Both experiments show significant bilateral activity in the putamen for this contrast. For experiment 1, peak voxels are p < 0.05 whole-brain FDR corrected. For experiment 2, peak voxels are p < 0.05 small volume corrected. Z refers to the level of the axial slice shown in stereotaxic MNI space. The graphs in b and c show mean activation (in arbitrary units) for the volume beat versus volume nonbeat and duration beat versus duration nonbeat contrasts (from experiment 1), and unaccented beat versus unaccented nonbeat contrast (from experiment 2). b shows extractions from basal ganglia regions (as defined by Tzourio-Mazoyer et al., 2002) that were of a priori interest in this study. c shows extractions from peak voxels in additional regions active in all rhythms versus rest contrast in experiment 1. *p < 0.05 (significant difference between beat and nonbeat for that condition). R, Right; L, left; SMG, supramarginal gyrus; MFG, middle frontal gyrus.