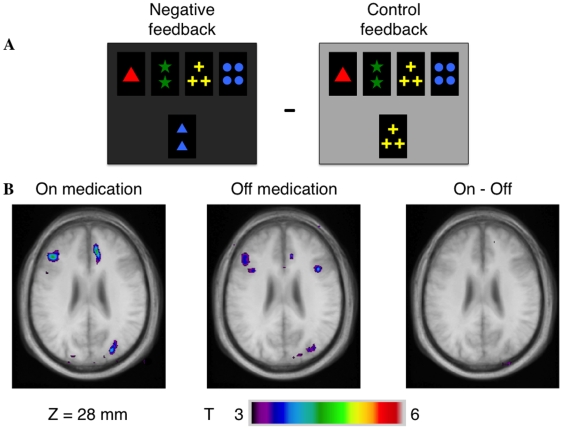
Figure 1. Patterns of activation in the left VLPCF and right cingulated cortex when receiving negative feedback compared to control feedback.
A – appearance of the monitor when receiving negative feedback and control feedback. B – axial section (z = 28 mm) in the ON and OFF groups and in the intergroup analysis showing greater activations in the ON – OFF comparison.

