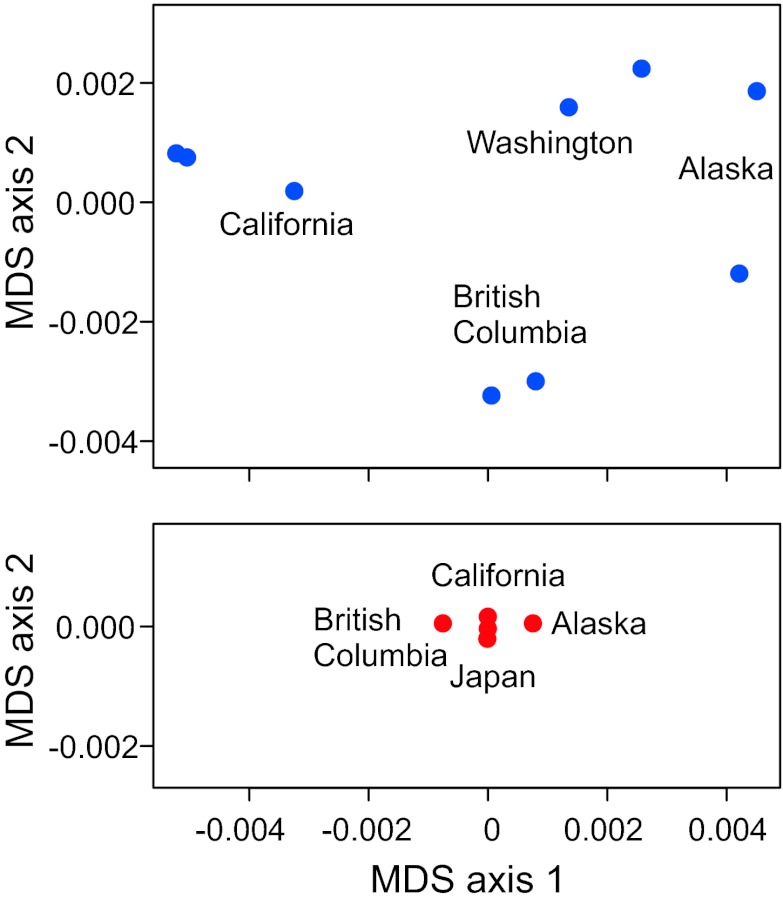
Fig. 6.
Multidimensional scaling (MDS) of low-armor Eda sequences from different freshwater populations (Upper) and of high-armor Eda sequences from marine populations (Lower) all within the Pacific basin. Axes are scaled so that magnitudes are comparable in both plots and along both axes. Data are from ref. 42.

