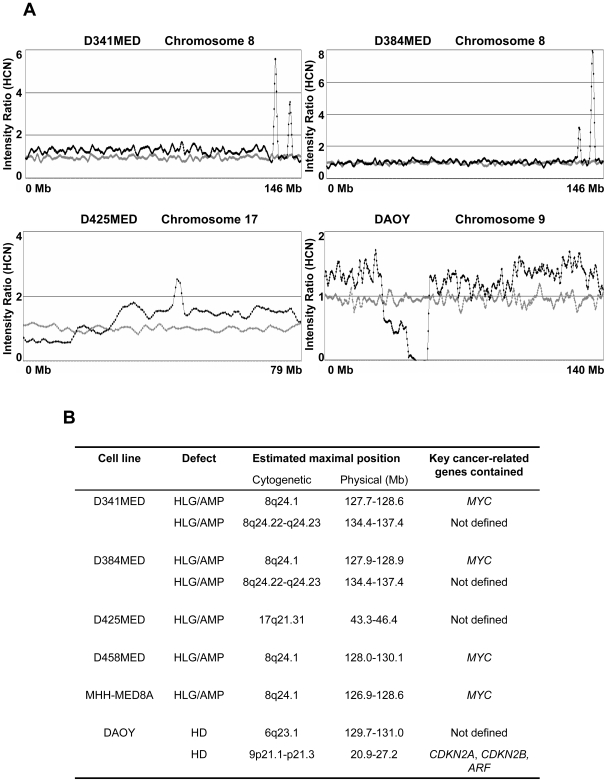
Figure 1. Homozygous deletions and genomic amplifications/high level gains identified in medulloblastoma cell lines.
[A] Illustrative copy number studies for medulloblastoma cell lines showing defects detected by the SNP-array analysis. Data were analysed and displayed as previously described (Bignell, Huang et al. 2004). Probes are displayed by their physical position on the chromosome (X-axis), from p-ter to q-ter (left to right). The smoothed intensity ratio, based on a ‘moving window’ average of five adjacent probes is indicated by the Y-value. Mean values for a panel of 29 normal samples are represented by the grey dots, while the values of the medulloblastoma cell line are shown in black. In this figure, two independent amplifications/high level gains at 8q24 are shown in D341MED and D384MED, as well as an amplification/high level gain at 17q21 in D425MED and a homozygous deletion at 9p21 in DAOY. [B] Detailed information for defects identified affecting more than two adjacent markers. Estimated maximal cytogenetic and physical positions of each defect are shown, as well as any known key cancer-related gene contained within the region. HCN, estimated haploid copy number; HLG/AMP, high level gain or genomic amplification; HD, homozygous deletion.

