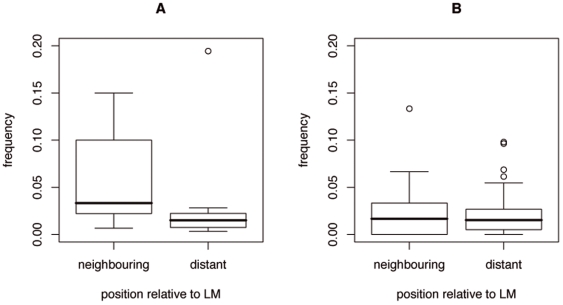
Figure 4. Frequency of coupling between LM and neighbouring or distant residues.
Box plots show the distribution of the frequency of coupling for instances in Table 2. A. Distribution for instances whose presence/absence is better described by the local rather than the global sequence conservation (i.e. locCons correlation<globCons correlation) B. Distribution for instances with globCons correlation<locCons correlation.

