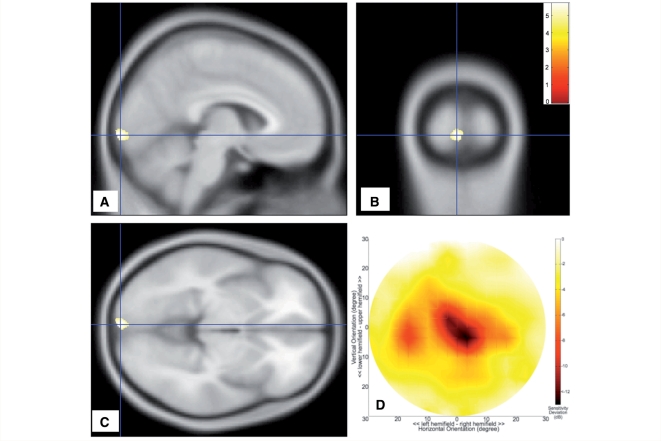
Figure 2.
Analysis of subjects with AMD. (A–C) Sections of the brain showing regions of grey matter density reduction. Colours indicate statistical significance (t-values), with red indicating more significant changes, and yellow/green indicating less significant changes (all changes are at least P < 0.001, uncorrected). (D) Mean visual field sensitivity deviation (in dB). The largest change in sensitivity is located centrally in the visual field. dB = decibel.

