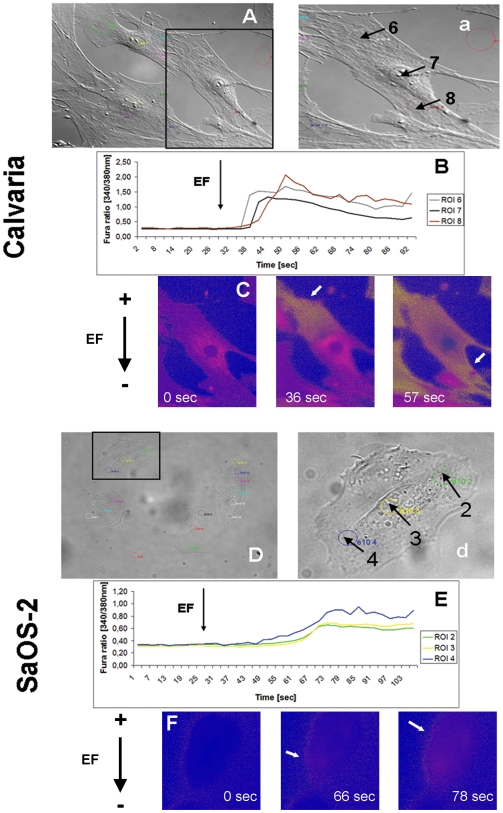
Figure 5. Local and opposite Ca2+ initials in Fura-loaded calvaria and SaOS-2 cells exposed to strong dcEF (14 V/cm).
(A,a) and (D,d) DIC images of calvaria and SaOS-2 cells with ROIs within colored circles. (B) One-cell Fura kinetics representing the sequential elevation of [Ca2+]i first at anode-facing side (ROI 6, grey circle) and its propagation through the cell (ROI 7, black circle) to the cathode-facing side (ROI 8, dark red circle) of a calvaria cell. (E) The same pattern but opposite direction in a SaOS-2 cell. (C,F) False color time-lapse frames showing the contrary initiation and propagation (white arrows) of [Ca2+]i elevation in calvaria and in SaOS-cells. 15–17 cells from a total of 22–23 were scored from 6–10 independent experiments.

