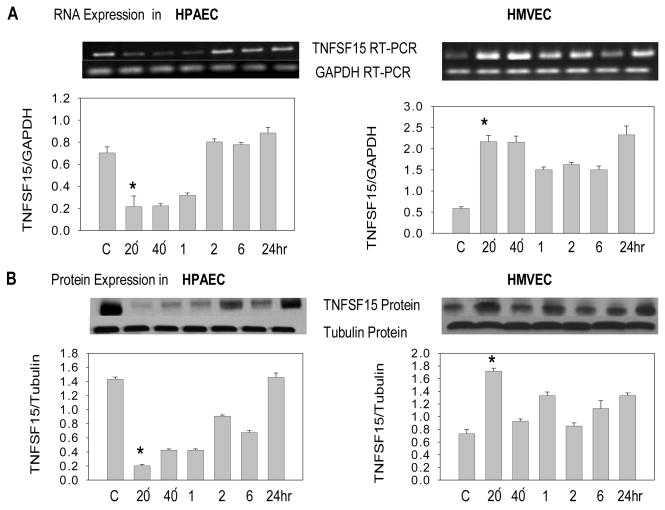
Fig. 2. Effect of TNF-α on TNFSF15 expression in HPAEC and HMVEC.
(A) TNFSF15 RNA expression in untreated (C) and TNF-α (40 ng/ml) treated HPAEC and HMVEC at 20 min, 40 min and at 1, 2, 6 or 24 hrs. The TNFSF15 gene specific PCR amplified product (750bp) and GAPDH amplified product (177bp) are demonstrated. Graphic representation of mean TNFSF15 expression corrected for GAPDH for each time point (± SEM) is presented (n=3); (B) Western analysis of TNFSF15 (31 kDa) and tubulin (50 KDa) expression. Graphic representation of mean TNFSF15 protein expression corrected for tubulin expression at each time point (± SEM) is presented (n=3).

