
Figure 2. Soluble Aβ enhances hippocampal LTD through mGluR or NMDAR, depending on the stimulation protocol.
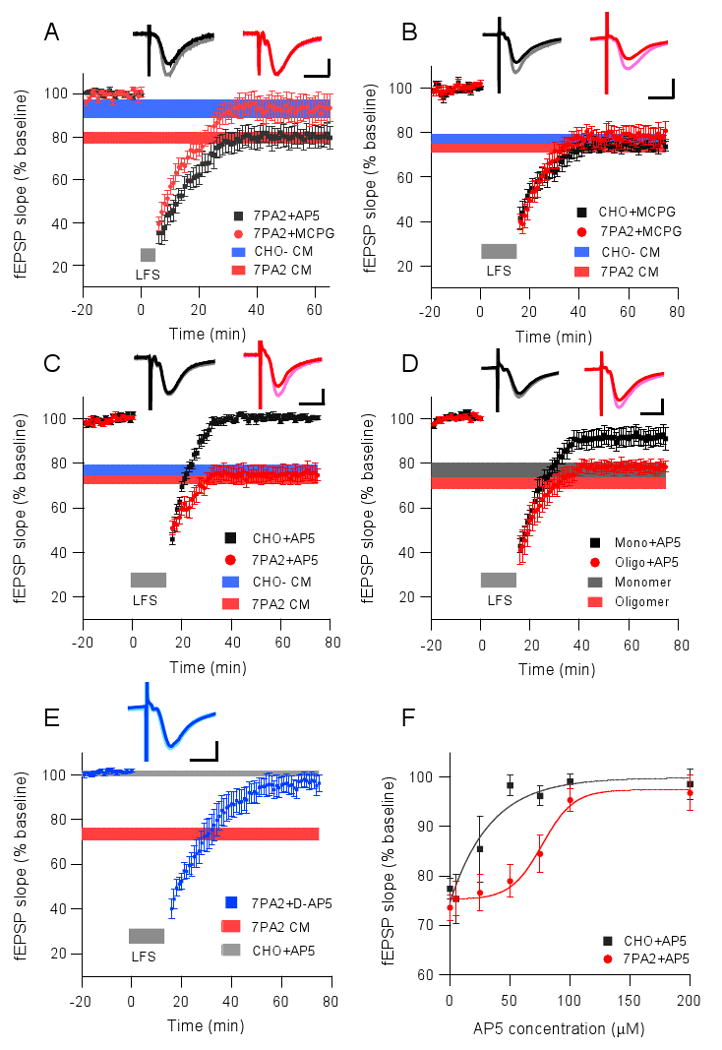
(A) LTD induced by the 300-pulse protocol (grey bar) in the presence of 7PA2 CM was blocked upon coadministration of the non-selective group I/II mGluR antagonist, MCPG (500 μM, red circles, n=6), but not the NMDAR antagonist, AP5 (50 μM, black squares, n=5). Horizontal colored bars represent the corresponding means ± SEMs from data shown in Fig.1B. (B) LTD induced by the 900-pulse protocol (grey bar) is independent of mGluR activation. Horizontal colored bars represent the corresponding means ± SEMs from data shown in Fig.1C. (C) The 900-pulse LTD induced in slices in CHO- CM was blocked by co-administering the NMDAR antagonist, AP5 (50 μM, black squares, n=8), whereas LTD in slices in 7PA2 CM was unaltered (red circles, n=6). Horizontal colored bars from data in Fig.1C. (D) 900-pulse LTD in Aβ monomer treated slices was blocked upon co-perfusing AP5 (50 μM, black squares, n=5), whereas the LTD in oligomer-treated slices was not (red circles, n=6). Horizontal colored bars represent the corresponding means ± SEMs from Fig.1F. (E) 7PA2 CM enhanced LTD was blocked by treatment with D-AP5 at 100 μM (n=5). Horizontal colored bars represent the corresponding means ± SEMs from Fig.2C. (F) Does-response curves of LTD blockade by AP5 in either CHO- CM (black squares) or 7PA2 CM (red circles). Insets in A-E represent typical fEPSPs recorded before (light) and 50 min after (dark) the LFS. Horizontal calibration bar, 10 ms; vertical bar, 0.5 mV.