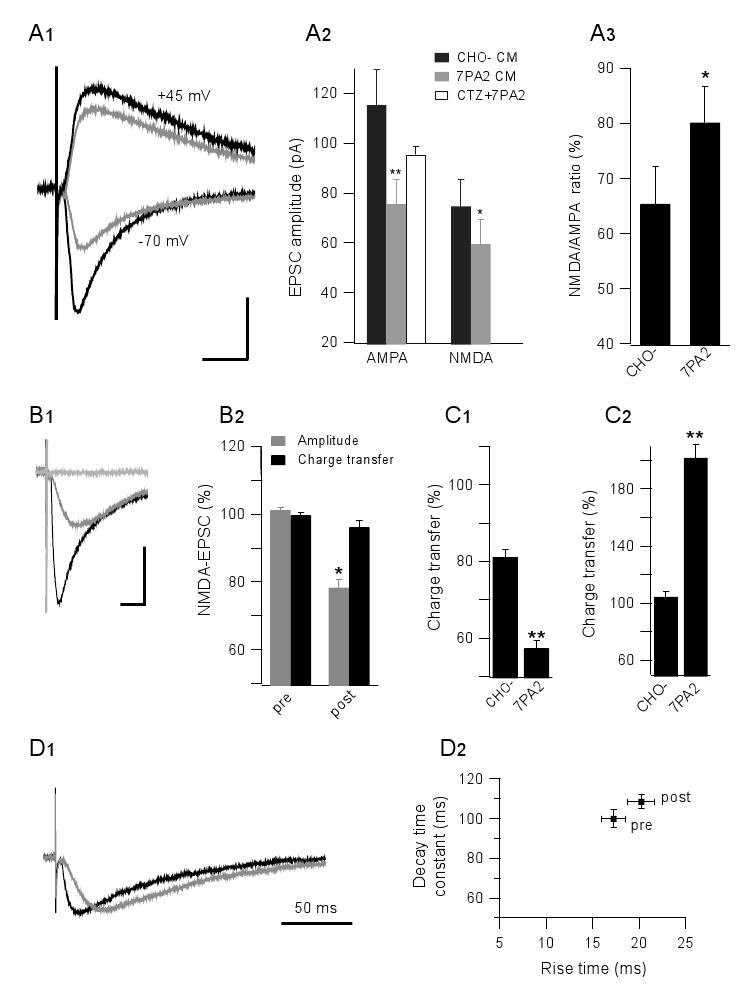
Figure 4. Soluble Aβ oligomers alter NMDAR-mediated EPSCs in whole-cell voltage clamp recordings.

(A1) Isolated AMPA-EPSC and NMDA-EPSC were recorded from -70 mV and +45 mV holding potentials, respectively, plus pharmacological blockers. Black traces, CHO- CM treated cells; grey traces, 7PA2 CM treated cells. (A2) Summary data for CHO- CM (black) and 7PA2 CM (grey) groups, and for pre-treatment with cyclothiazide (CTZ, 100 μM) prior to 7PA2 CM (white). (A3) NMDA/AMPA EPSC ratios are different in CHO- CM and 7PA2 CM. (B1) Typical traces from CA1 pyramidal cells held at −70 mV (black), isolated NMDA-EPSC in low Mg2+ with NBQX (10 μM) and bicuculline (20 μM) at -70 mV (grey), and full blockage of the NMDA current by AP5 (50 μM) (light grey). (B2) Summary data for the isolated NMDA-EPSC before (pre) and 20-30 min after 7PA2 CM exposure. Peak amplitudes (grey) and total charge transfers (black) are expressed as means ± SEMs. (C1) The selective NR2B inhibitor, ifenprodil (3 μM), modestly reduces NMDA charge transfers in control but markedly reduces it in 7PA2 CM. (C2) 7PA2 CM significantly increases the extrasynaptic response when synaptic NMDAR are first blocked by MK-801. (D) NMDA-mediated EPSC kinetic analysis: left panel, representative scaled traces before (black) vs. after (grey) 7PA2 CM exposure; right panel, summary data of rise time plotted vs. decay time before (pre) and after (post)7PA2 CM exposure.
