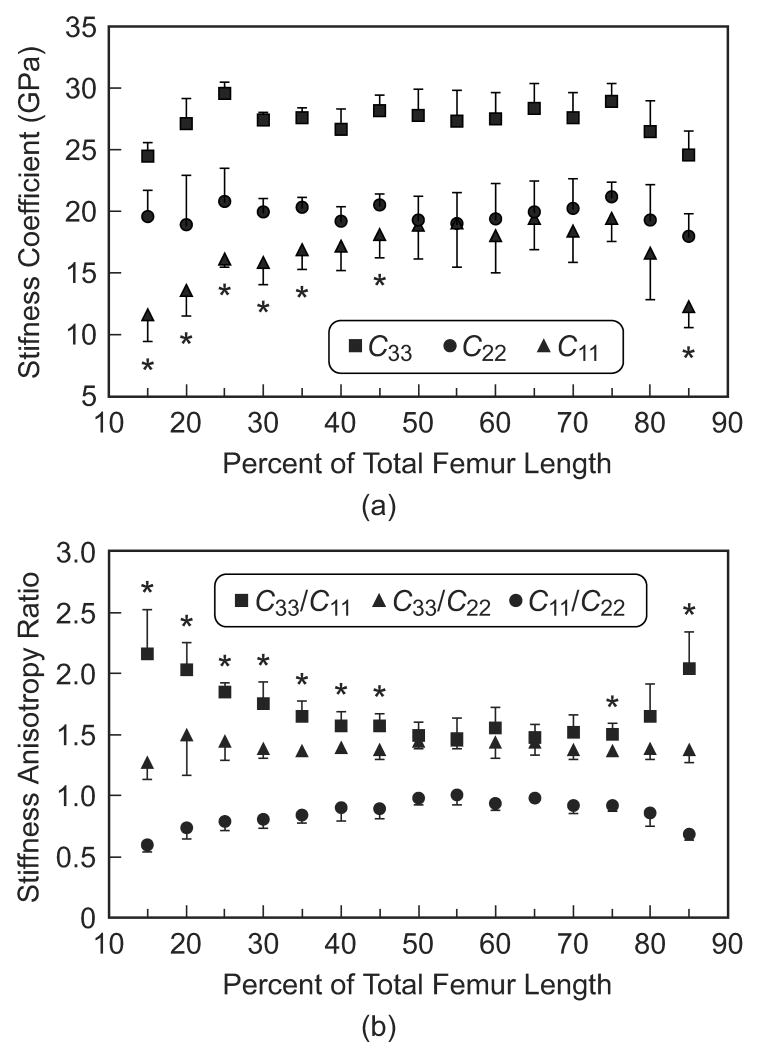
Figure 4.
Mean (a) stiffness coefficients and (b) anisotropy ratios in the three specimen axes measured along the length of the femoral diaphysis. Error bars span one standard deviation. Asterisks denote statistically significant differences between (a) C11 and C22, and (b) C33/C11 and C33/C22 at locations along the length of the femoral diaphysis (p < 0.05, t-test). Statistically significant differences existed between (a) C33, and (b) C11/C22, and other groups at all locations along the length of the femoral diaphysis (p < 0.01, t-test).

