
Figure 4.
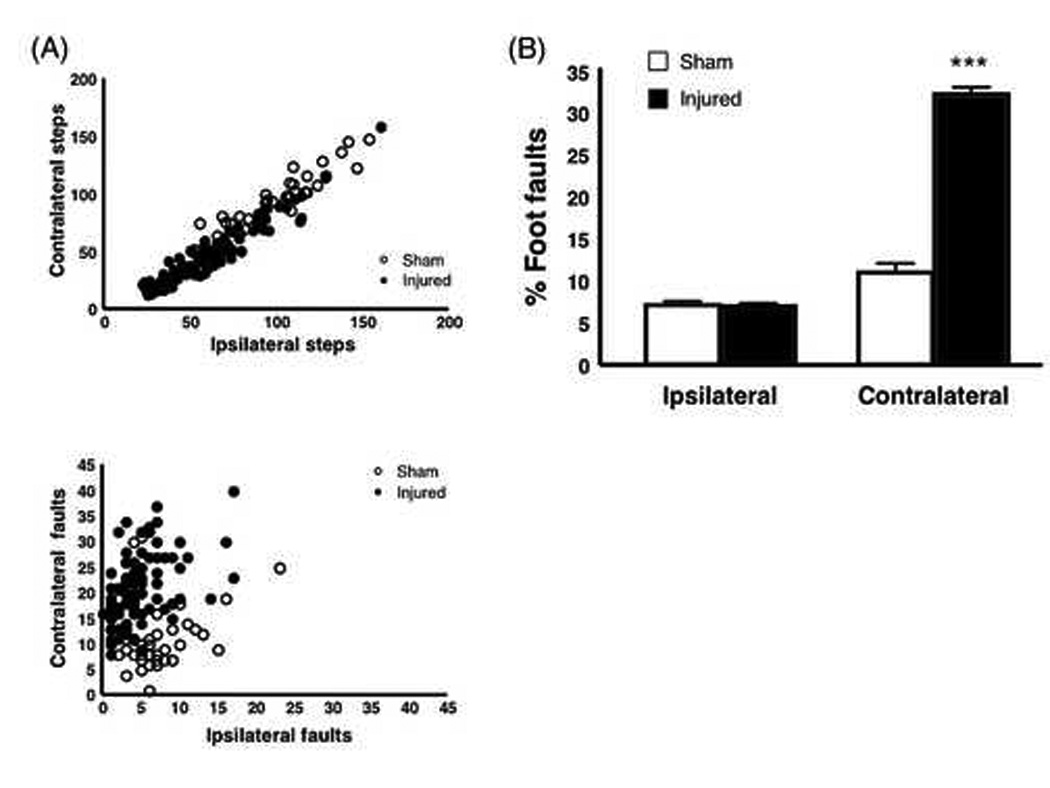
Foot Fault Test. (A) Steps and foot faults in the injured and sham mice 3 days after TBI. Scattergrams show the total number of contralateral steps (top) or contralateral faults (bottom) plotted against ipsilateral steps and faults, respectively. Circles represent values for individual animals. The total number of contralateral steps is highly correlated with the number of ipsilateral steps for both sham and injured mice (R2 = 0.94 and 0.95, respectively). In contrast, the correlation between contralateral and ipsilateral foot faults is weaker (sham, R2 = 0.27; injured R2 = 0.42). (B) Percentage of attempted steps resulting in foot faults. Injured mice had a significantly higher percentage of contralateral foot faults compared with sham mice. The percentage of foot faults on the ipsilateral side was nearly equal in both sham and injured mice. ***p < 0.0001. (sham, n = 37; injured, n = 88)