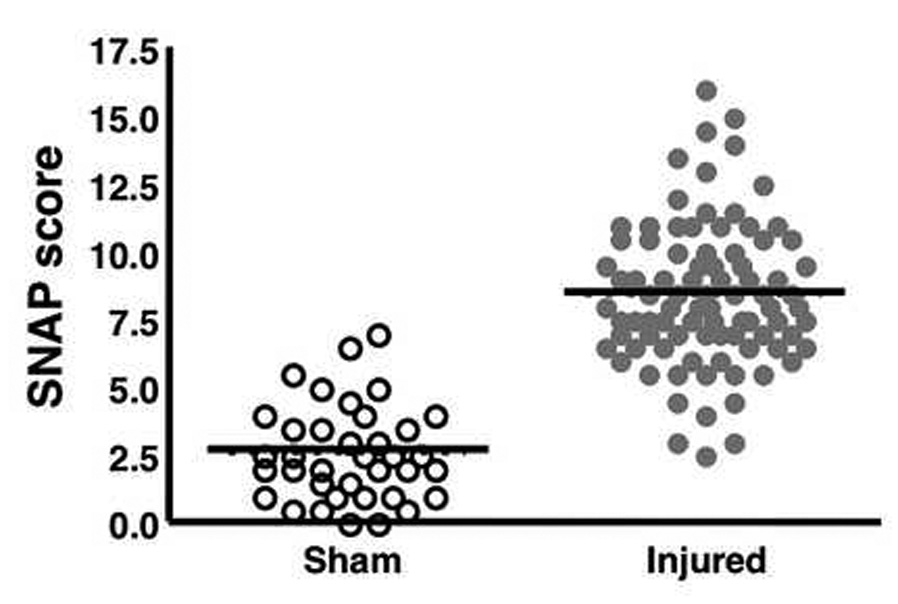
Figure 7.

The SNAP scores in injured and sham mice. A scattergram shows the distribution of SNAP scores. Circles represent values for individual animals and the lines indicate the mean for each group (sham, 2.6 ± 0.29; injured 8.4 ± 0.28). Injured mice had significantly higher mean SNAP scores than sham mice 3 days after surgery (p < 0.0001). Median values are sham, 2.5 and injured, 8.0. (sham, n = 37; injured, n = 88)
