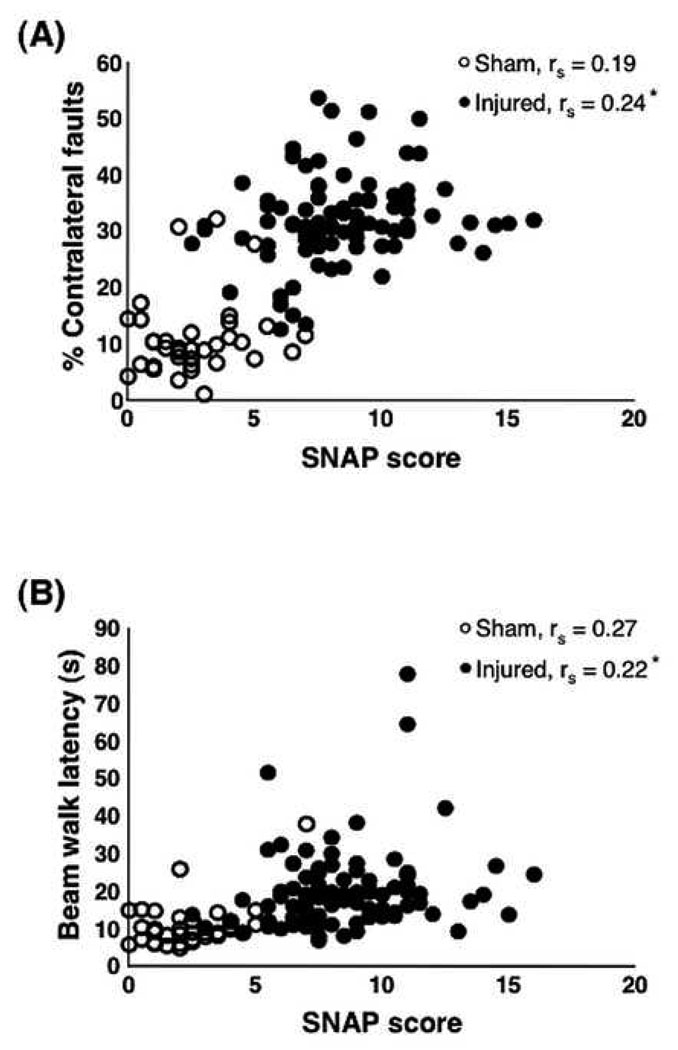
Figure 8.
Correlation of individual SNAP scores with foot fault and beam walk tests. (A) There was a weak, albeit significant positive correlation between the injured SNAP scores and percent of contralateral foot faults (p = 0.024); however, the correlation among the sham animals was not significant (p = 0.251). (B) There also was a significant weak positive correlation between injured SNAP scores and beam walk (p = 0.04) and no significant correlation among the sham mice (p = 0.10). Data analyzed using the Spearman Rank Correlation (rs) test (sham, n = 37; injured, n = 88).

