
Figure 9.
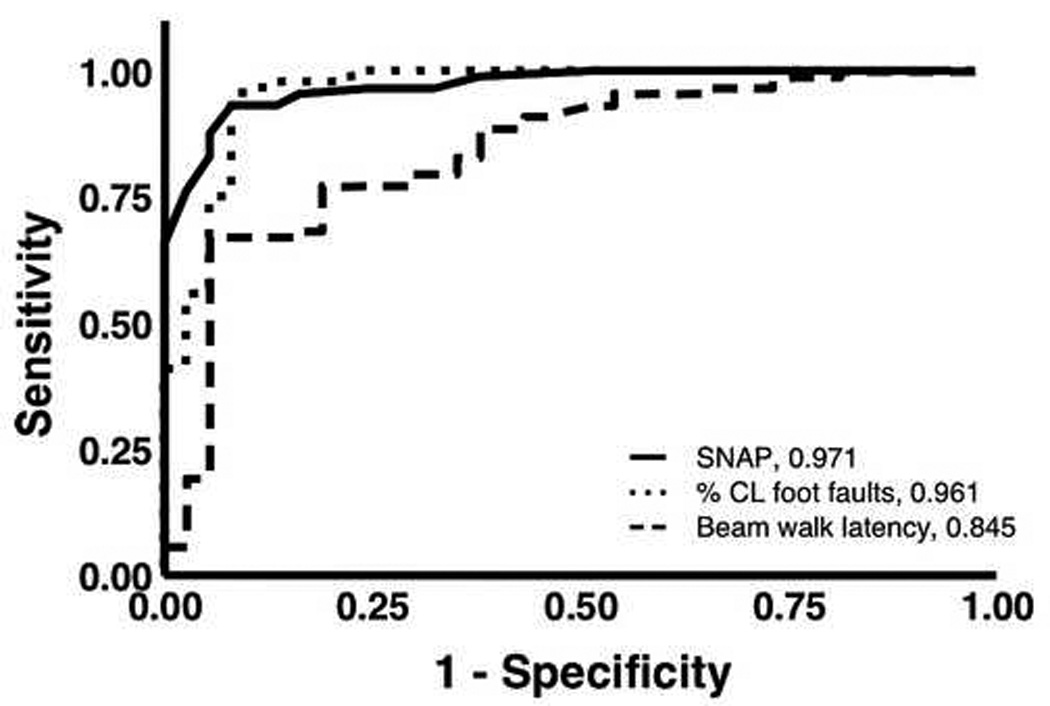
ROC curve analysis. A comparison of three tests used in this study, three days after surgery. SNAP, foot faults (%CL, percentage of contralateral faults to total steps), and beam walk have AUCs of 0.971, 0.961, and 0.845, respectively. The accuracies of both SNAP and foot fault tests were significantly higher than that of beam walk (p = 0.001 and 0.007, respectively). The difference in accuracy between SNAP and foot fault was not significant (p = 0.667). (sham, n = 37; injured, n = 88).