. 2008 Oct;14(4):174–177. doi: 10.4103/1319-3767.43274
© The Saudi Journal of Gastroenterology
This is an open-access article distributed under the terms of the Creative Commons Attribution License, which permits unrestricted use, distribution, and reproduction in any medium, provided the original work is properly cited.
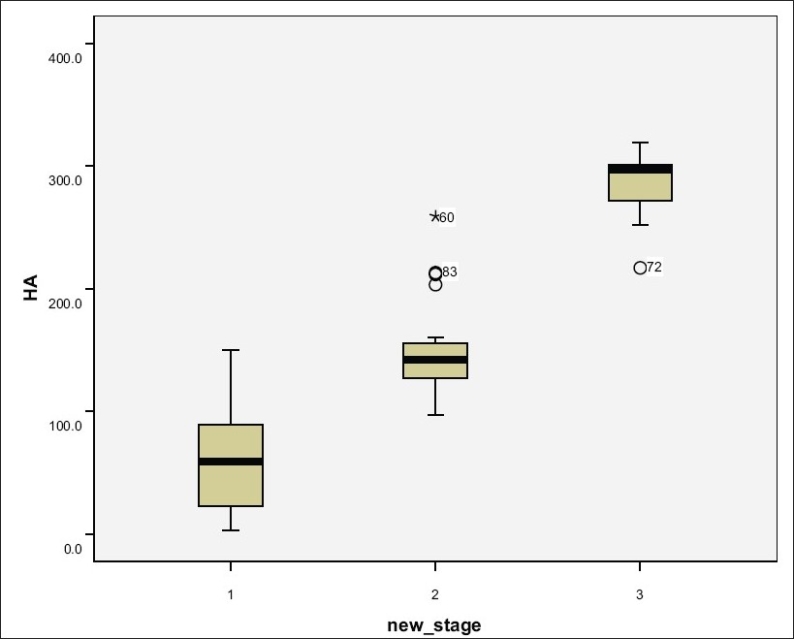
Figure 1.

HA concentrations of patients' groups
