Figure 3.

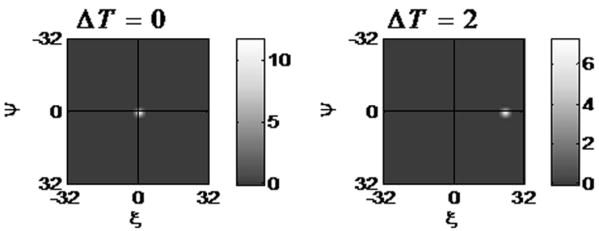
STICS analysis of simulated data plotted at two STICS shifts (and frames). The simulated data has a velocity of 10pixels/frame and this is reflected in the STICS peak shift of 20 pixels.

STICS analysis of simulated data plotted at two STICS shifts (and frames). The simulated data has a velocity of 10pixels/frame and this is reflected in the STICS peak shift of 20 pixels.