
Figure 4.
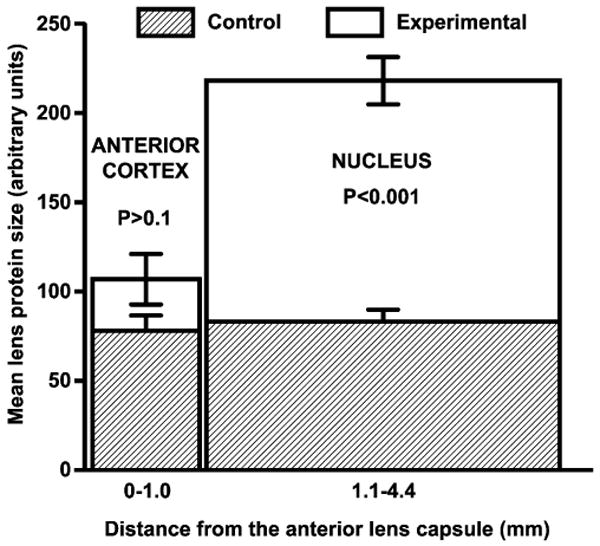
Analysis of average in vivo dynamic light scattering data for measurements taken across the lenses of control and UVA-treated guinea pigs. Measurements of average protein diameter were made every 0.1 mm across the optical axis of each lens (see legend of Fig. 3). These data were then averaged for two regions of each lens for control animals and animals exposed to UVA light. Analyses were conducted at 3 and 5 months of UVA exposure and the data combined (n = 6, control; n = 5, UVA-exposed). The total numbers of measurements made for each region were: control anterior cortex: 66; experimental anterior cortex: 88; control nucleus: 204; and experimental nucleus: 270. Each result is expressed as the mean ± SEM.