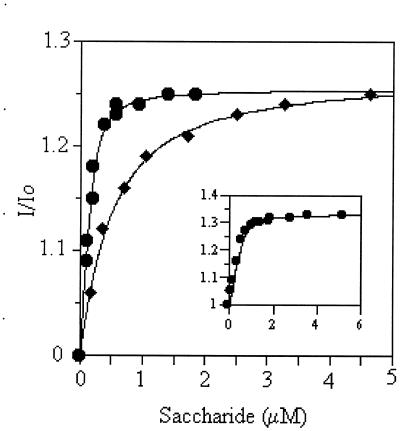
Figure 5.
Fluorescence titration of AT-III with either full-length heparin (●) or AT-10 (⧫) at pH 6.0, I = 0.025. Data are plotted as the ratio of AT-III fluorescence upon the introduction of saccharide to the initial AT-III fluorescence (I/Io) vs. concentration of added saccharide. The data were fitted by nonlinear regression and the KD was determined. For heparin the measured KD value was 10 nM, whereas for AT-10 this value was 800 nM. (Inset) The binding of heparin to AT-III at pH 7.4, I = 0.15. The measured KD of 36 nM agrees favorably with other determinations of the affinity of heparin for AT-III.

