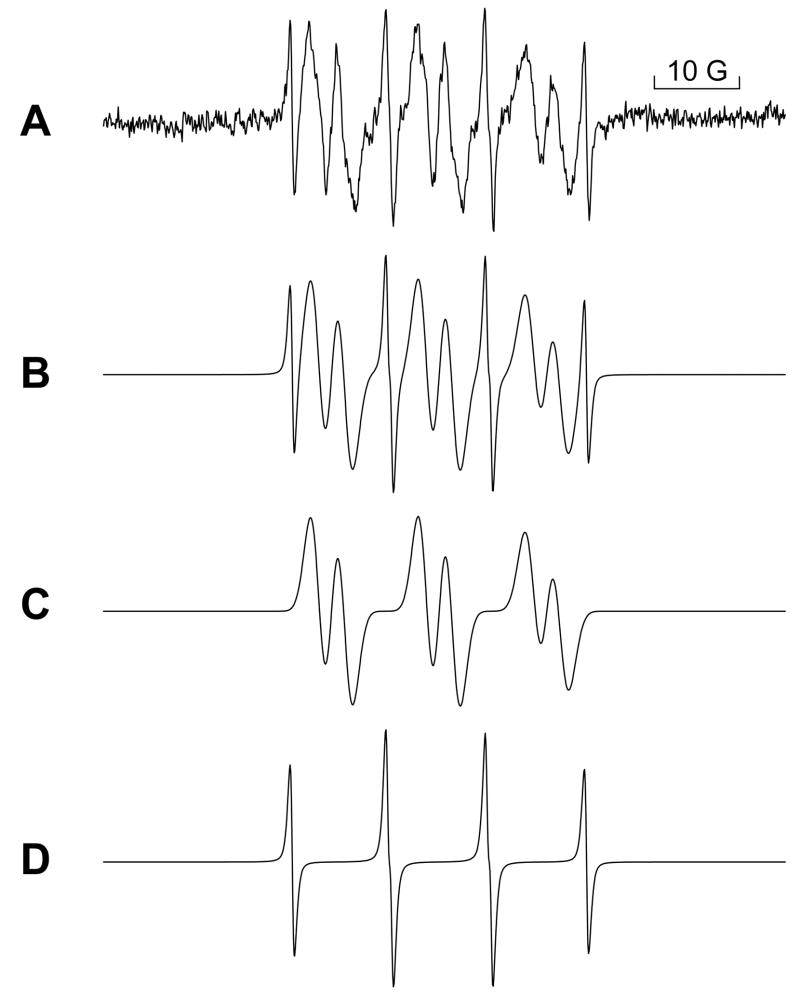
Figure 5. Simulation of the experimental spectrum shown in Figure 4C using Win Sim software.
In the absence of CEES, the spectrum in Figure 6A was found. The hyperfine splitting constants were simulated, which produced the closly correlating spectrum shown in Figure 5B. One component containing four sharp lines (Figure 5D and 6D) resulted from the hydrogen free radical commonly appearing in spin trapping experiments using MNP. The other component containing six lines only appeared in the absence of CEES and is thought to arise from the formation of a carbon centered radical present in the enzyme preparation. The 10 Gauss bar is included to define the scale. (See Results)

