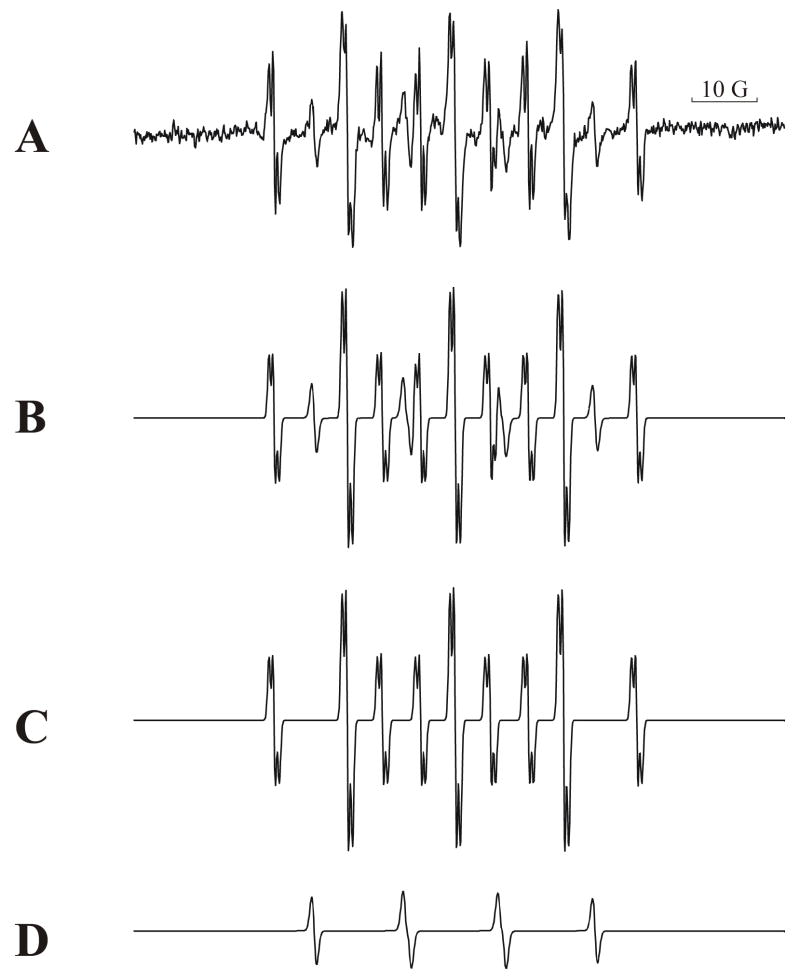
Figure 6. Simulation of the experimental spectra shown in Figure 4 using Win Sim software.
Figure 6A is the original experimental spectrum of the spin trapped MNP-CEES free radical adduct. Figure 6B is the computer simulation of 6A. Figures 6C and 6D show the individual components of the simulation. Figure 6C is the MNP trapped free radical generated by the enzymatic reduction of CEES. Figure 6D is the trapped hydrogen free radical commonly appearing in control and spin trapping experiments employing MNP. Figure 6D contributes 15.6% of the area under the total spectrum shown in Figure 6B. The 10 Gauss bar is included to define the scale.

