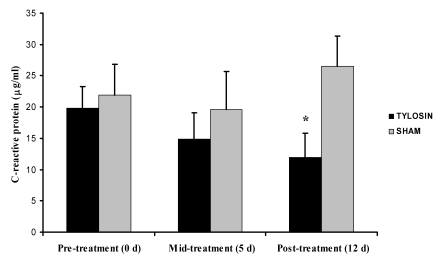
Figure 5.
Serum C-reactive protein levels for tylosin- and sham-treated groups at 0, 5, and 12 d after initiation of therapy. CRP levels did not differ between groups at either 0 or 5 d, but day 12 levels differed significantly (*, P = 0.029, Wilcoxon rank-sum test) between tylosin- and sham-treated animals. Data are presented as mean ± SE.

