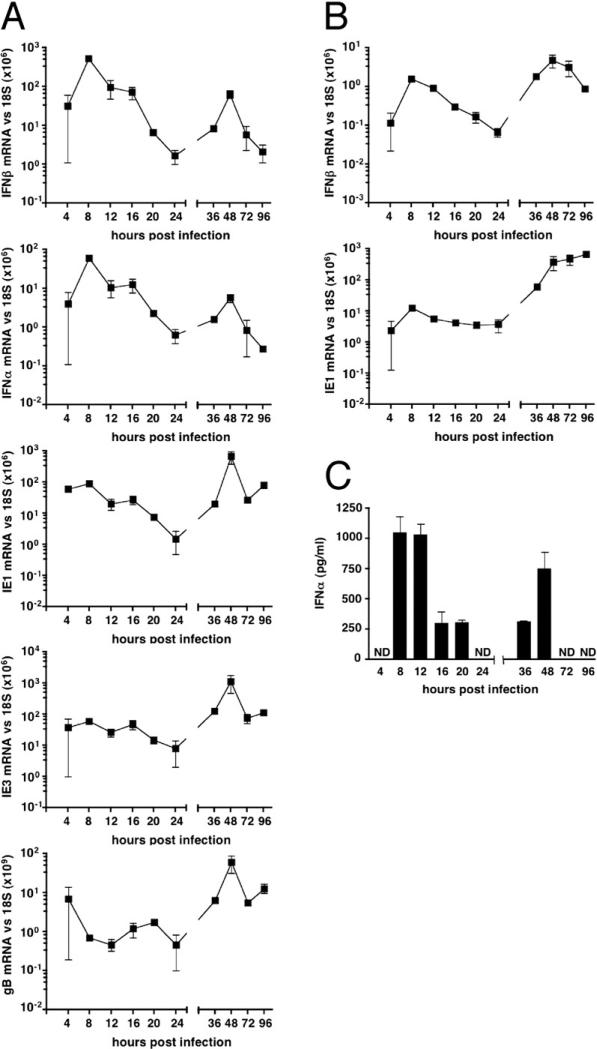
Figure 1. Analysis of the IFNαβ Response during MCMV Infection.
B6 mice were infected with MCMV (2 × 10⁵ PFU i.p.), organs or serum were harvested at the indicated times for analysis. (A) The mRNA levels in the spleen for IFNβ, INFα, and MCMV ie1, ie3, and gB was determined by quantitative RT-PCR (qPCR) analysis of total cell RNA. All qPCR values are shown normalized to the levels of 18S rRNA. The baseline mRNA level in mock-infected B6 mice for IFNβ was 2 × 10⁻³/18S × 106 and INFα 3 × 10⁻⁴/18S × 106.
(B) Liver mRNA from infected B6 mice as in (A).
(C) Serum INFα levels were determined by ELISA (ND, not detectable). Each time point represents 3 to 6 mice per group, mean ± SEM.

