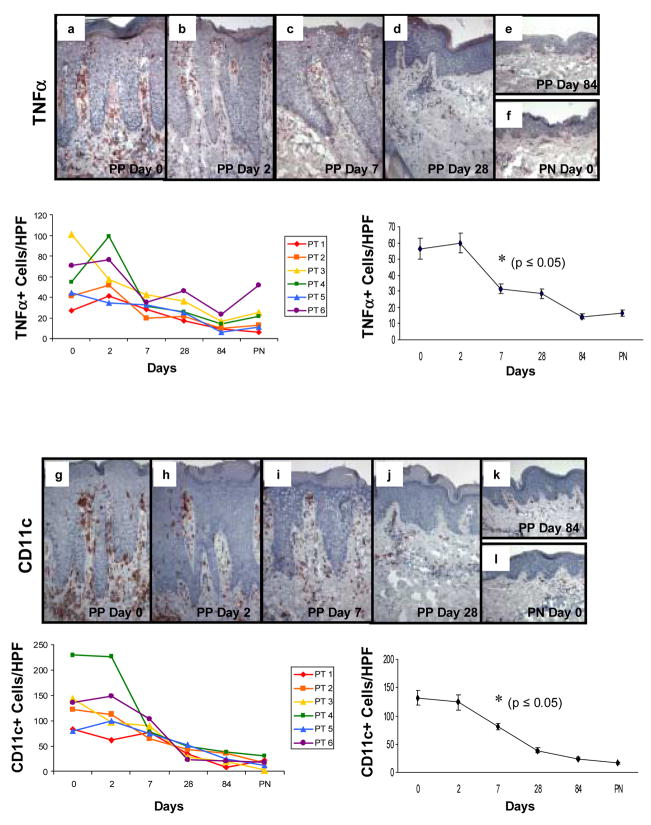
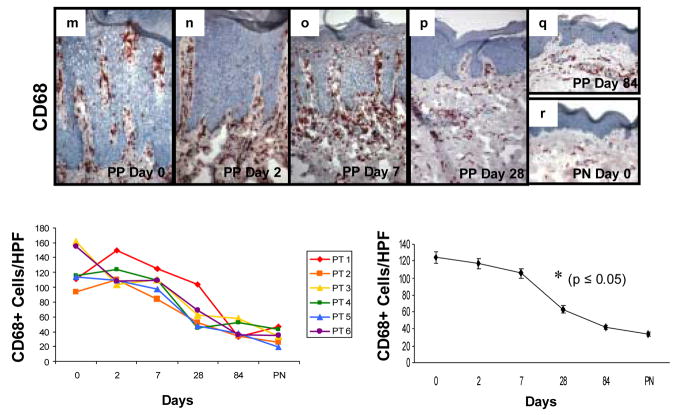
Figure 4. Expression and kinetic profile highlighting temporal reductions in density of TNFα +, CD11c+, and CD68+ cells in psoriatic patients before and after treatment with adalimumab.
Untreated PP skin (PP day 0) is characterized by an increased number of mononuclear cells expressing TNFα compared to PN skin (a and f), as well as increased number of CD11c+ cells (g and l), and CD68+ cells (m and r). Beneath each representative staining profile of untreated and treated PP skin and PN skin are panels depicting individual data points for each of the six treated subjects (left side), as well as a summary panel depicting mean +/− SEM for the group (n=6). For each treated subject, a color and symbol are provided to delineate a specific patient in figures 4 and 5.
Note the consistent and rapid reduction in TNFα expressing cells (panels b–e, s) which first became statistically significant at day 7 (asterisk; p<0.05), as does the reduction in density of CD11c+ cells (panels h–k, t); whereas the reduction in CD68+ cells does not achieve significance until day 28 (panels n–q; u). Note the parallel reduction in epidermal thickness that accompanies the diminution in the density of mononuclear cells at the indicated time points, consistent with our previous report [24].


