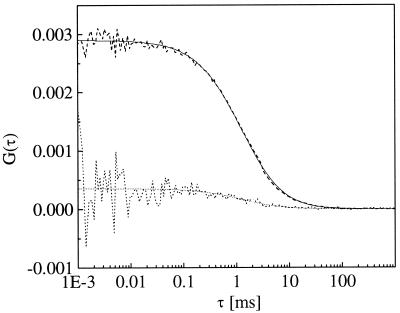
Figure 6.
Crosscorrelation curves recorded from a solution of double-labeled (dashed) or a mixture of single-labeled (dotted) DNA target resembling the start and end points of the cleavage reaction. Fits according to Eq. 4 are indicated as solid lines. The difference in correlation amplitudes (factor of 10) marks the dynamic performance of the setup.

