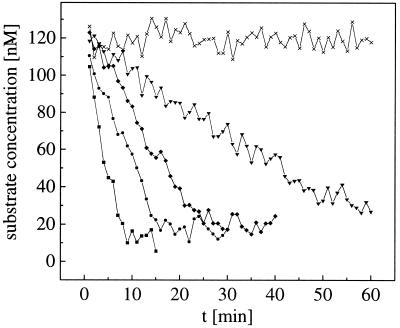
Figure 7.
Kinetics of enzymatic cleavage dependent on enzyme concentration (■, 0.25 units/μl; ●, 0.125 u/μl; ⧫, 0.06 u/μl; ▾, 0.03 u/μl; x, negative control). Each data point is the averaged result from a 60-s measurement. The substrate concentration (initially 125 nM) can be derived from the amplitudes of the crosscorrelation functions during the reaction according to Eq. 7.

