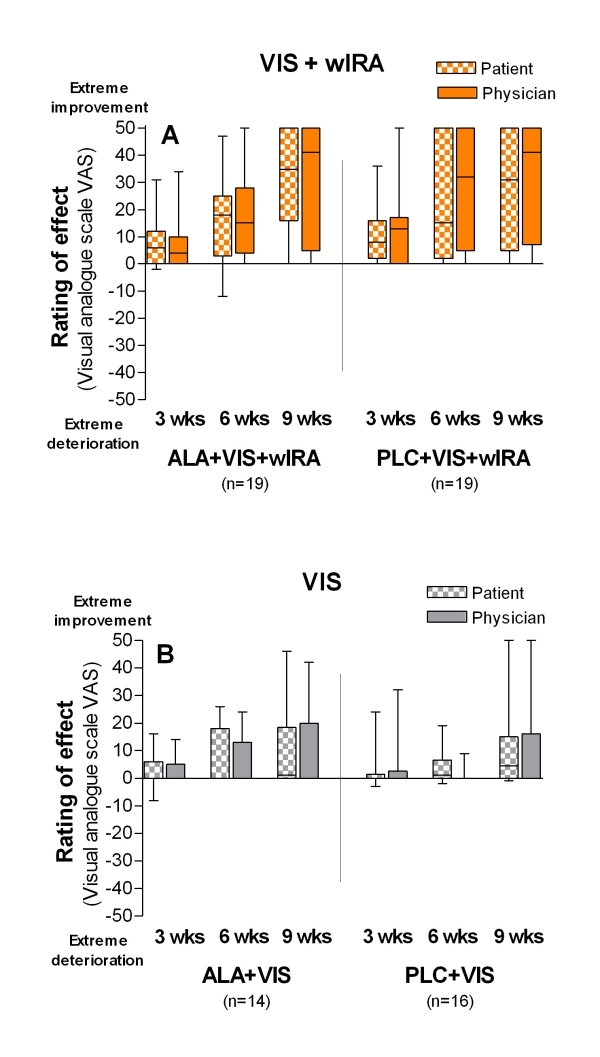
Figure 3. A+B: Estimation of the effect of treatment by patients and by physician.

("How do you estimate the effect of therapy?") with visual analogue scale VAS (-50 mm = extreme deterioration, 0 = no effect, +50 mm = extreme improvement) after 3, 6 and 9 weeks (given as minimum, percentiles of 25, median, percentiles of 75, and maximum (box and whiskers graph)).
Medians from left to right:
A: VIS+wIRA treated groups (with and without ALA):
Group 1: ALA+VIS+wIRA: +6/ +4, +18/+15, +35/+41
Group 2: PLC+VIS+wIRA: +8/+13, +15/+32, +31/+41
B: VIS treated groups (with and without ALA):
Group 3: ALA+VIS: +0/+0, +0/+0, +1/+0
Group 4: PLC+VIS: +0/+0, +1/+0, +5/+0
