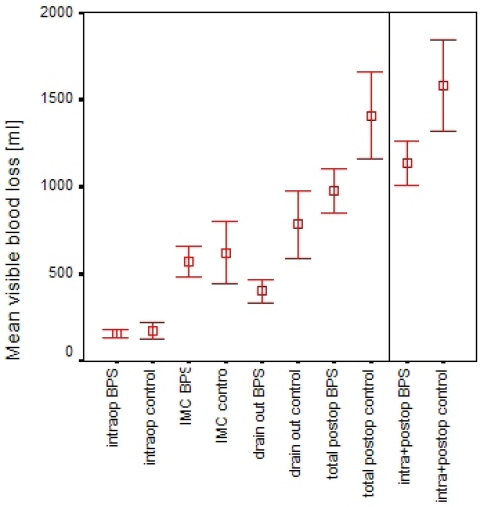
Figure 2. Mean visible blood loss in BPS vs. control group over time intraoperatively, on Intermediate Care Unit (IMC), on regular ward at time of drain removal (left from vertical line), and cumulated (TVBL, right from vertical line).
Group differences after IMC and cumulated differences as shown were highly significant. Bars represent 95% confidence intervals of mean values.

