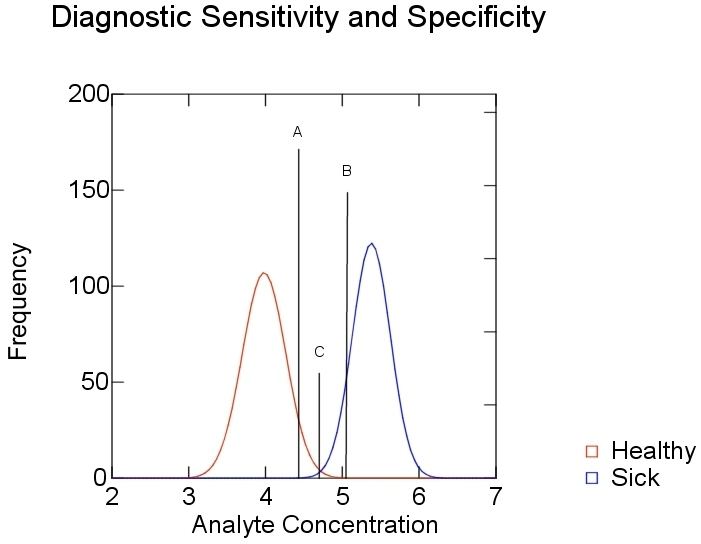
Figure 7. Smoothed data distribution curves for the data in Figure 6 .

Figure 7 shows the analyte concentration for 100% diagnostic sensitivity (A) and 100% diagnostic specificity (C). Point B shows the compromised "real-life" situation, where both diagnostic sensitivity and specificity are less than 100%. The abscissa and ordinates are as in Figure 6.
