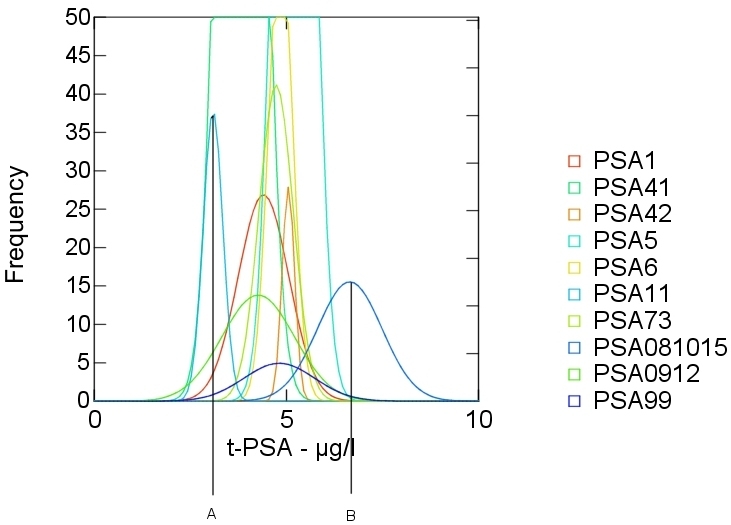
Figure 8. Data for Sample 2 in Table 15 (total PSA) highlighting the variabilty of measurement, both in absolute concentration and precision for the different kits on the market .

The abscissa and ordinate are as in Figures 5 and 7.

The abscissa and ordinate are as in Figures 5 and 7.