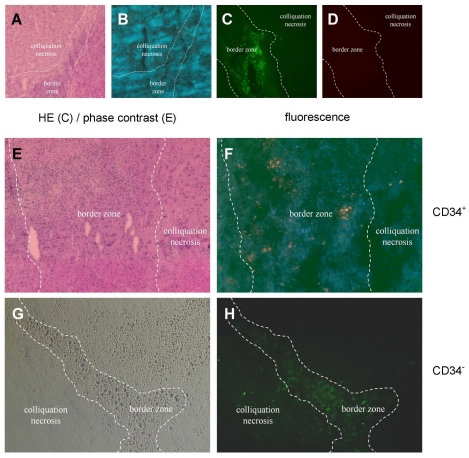
Figure 3. Tracking of CFSE-labelled CD34+ and CD34- HUCB cells in serial sections of SH in rat brains 29 days after MCAO.
A: control animal without cell therapy, HE staining; B: control animal, UV microscopy with green fluorescence; C: HUCB mononuclear cell treatment, green fluorescence, the borderline between the necrotic central area and the border zone to unaffected tissue is marked according to HE serial section; D: HUCB mononuclear cell treatment, red fluorescence; E: CD34+ HUCB cell treatment, HE staining; F: CD34+ HUCB cell treatment, green fluorescence (inverse colours); G: CD34- HUCB cell treatment, phase contrast microscopy; H: CD34- HUCB cell treatment, green fluorescence. 400fold magnification in all images.

