
Figure 4.
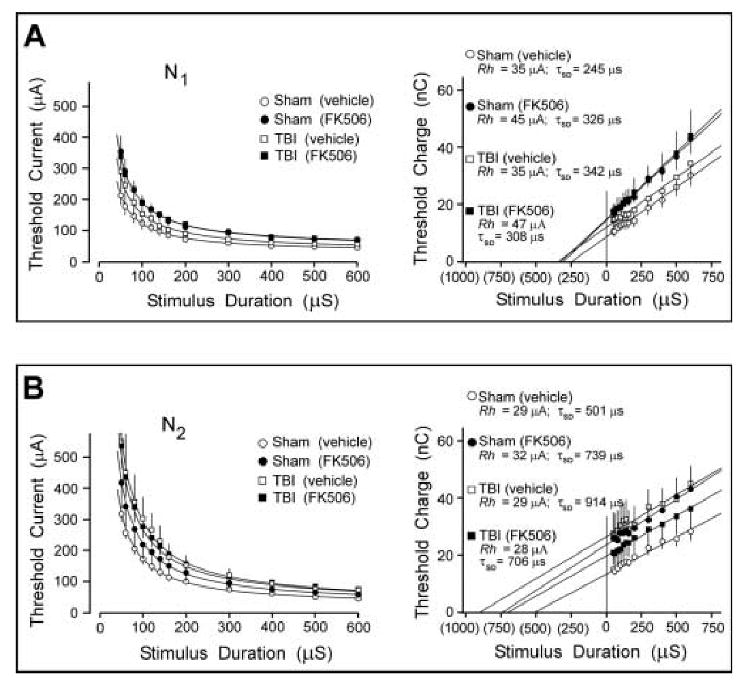
Effects of TBI and FK506 on strength-duration and charge-duration curves for N1 and N2 CAP components. A.[Left panel] Threshold data is plotted for N1 waves, and fitted to Weiss' formula (curves). [Right panel] Charge-duration transformation of the same data provides a graphical estimate of the strength-duration time constant (τSD) as an extrapolation of the regression line to the zero charge axis. Rheobase (Irh) is estimated as the slope of the regression line. τSD and Irh are listed for each analytic group above regression lines. B. Equivalent analysis of N2 threshold data. Overall, these analyses indicated that strength-duration properties of the N2 CAP were relatively more vulnerable to injury, and showed more neuroprotection following FK506 treatment, than was the case for the N1 CAP. TBI induced a significant shift in the N2 threshold curve, which was prevented by FK506. This corresponded to an 82% postinjury increase in the N2τSD, which was attenuated to 40% by FK506. In contrast, the N1 CAP showed minor threshold shifts associated more with FK506 than with TBI, and no significant changes in τSD.