
Figure 2.
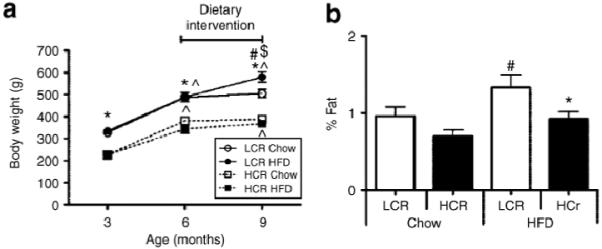
Effects of a high-fat diet (HFD) intervention in rats bred as low capacity runners (LCR) vs. high capacity runners (HCR). (a) Total body mass at baseline (3 months), before the dietary intervention (6 months), and upon death (9 months). (b) The percent fat from total body mass represented by epididymal fat pad weight obtained upon death. P < 0.05 for LCR vs. HCR within same diet category (*), for within-group weight gain from previous time point (^), for chow vs. HFD within a given strain (#), and greater weight gain in LCR rats on an HFD than any other group ($). Data are expressed as means SE. (Reproduced with permission by Noland et al. ref. 23.)