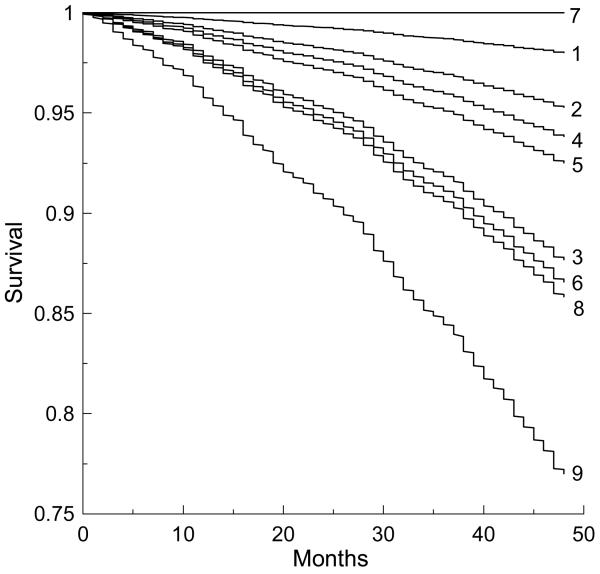
Figure 1.
Survival curves smoothed by Cox regression for each of the 9 selected sub-groups defined on the basis of categorization of the phenotypic frailty index (PFI) and deficit index (DI) into 3 categories (see Table 4) as robust, pre-frail, and frail: 1) PFI3robust and DI3robust; 2) PFI3robust and DI3pre-frail; 3) PFI3robust and DI3frail; 4) PFI3pre-frail and DI3robust; 5) PFI3pre-frail and DI3pre-frail; 6) PFI3pre-frail and DI3frail; 7) PFI3frail and DI3robust; 8) PFI3frail and DI3pre-frail; and 9) PFI3frail and DI3frail.

