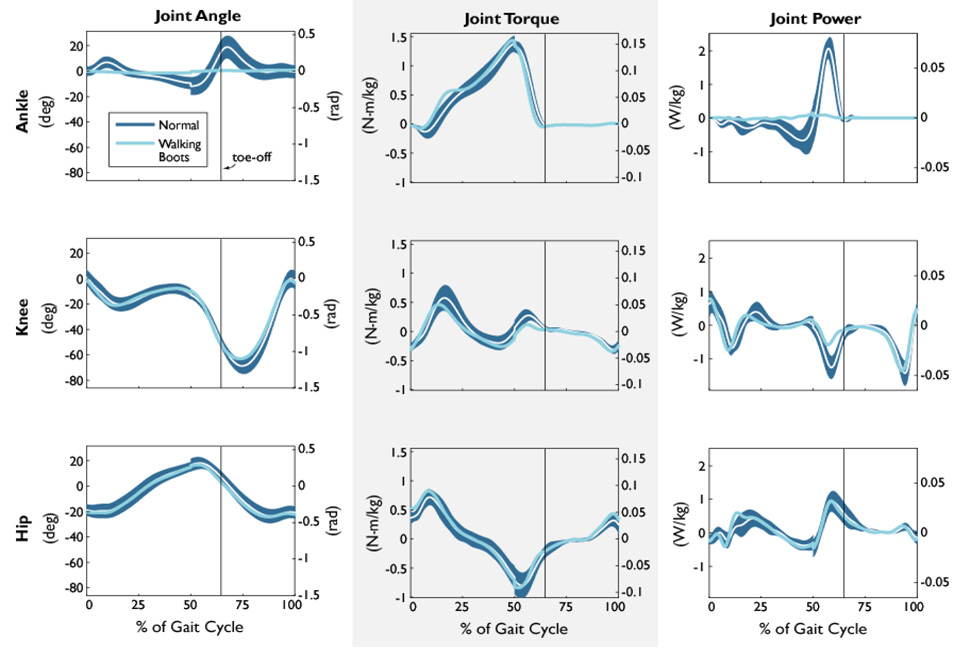
Figure 3.
Joint angles, torques, and powers over a stride, for ankle, knee, and hip joints. The range of Normal values, within 1 standard deviation of mean (shaded regions) across subjects is compared with the Ankles Fixed condition (N = 8). The greatest differences between conditions may be observed in ankle angles and powers, even though the torques are quite similar. Data shown are derived from one bilateral step, made to appear as one unilateral stride assuming lateral symmetry. The right-hand axes are labeled with dimensionless units.

