
Figure 3.
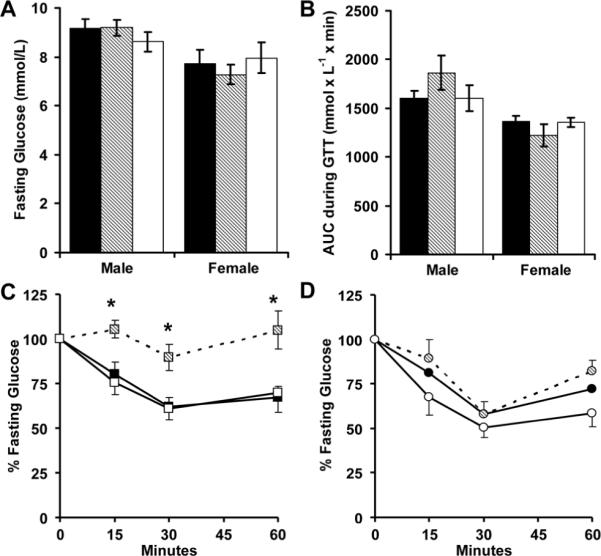
AA (■, N = 15 males and 14 females), RA (▨, N = 6 males and 8 females) and RR (□, N = 7 males and 6 females) mice received standard feed for 20 weeks. Glucose levels were then measured while fasting (A) for intraperitoneal glucose tolerance tests (B), or insulin tolerance tests (C, male; D, female). *p<0.05 versus AA