
Figure 6.
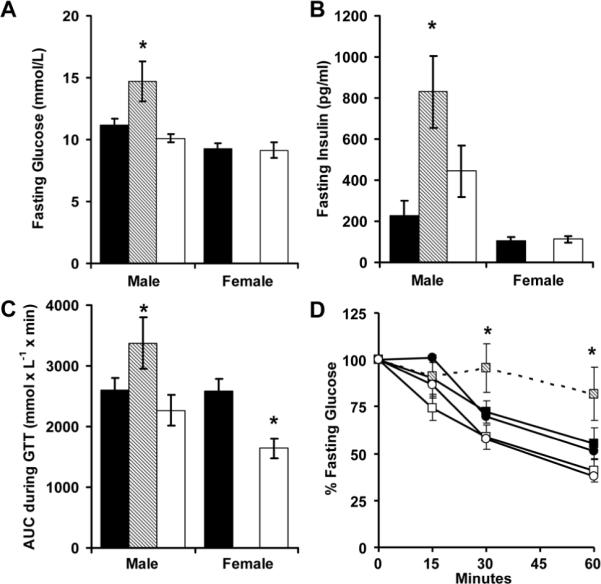
After AA (■, N = 14 males and 14 females), RA (▨, N = 6 males) and RR (□, N = 7 males and 6 females) mice were switched to high fat feed for 20 weeks, glucose (A) and insulin (B) levels were measured while fasting. Mice then received intraperitoneal glucose (2 g kg-1; C) or insulin (0.75 units kg-1; D; squares males, circles females) and glucose levels were monitored. *p<0.05 versus AA