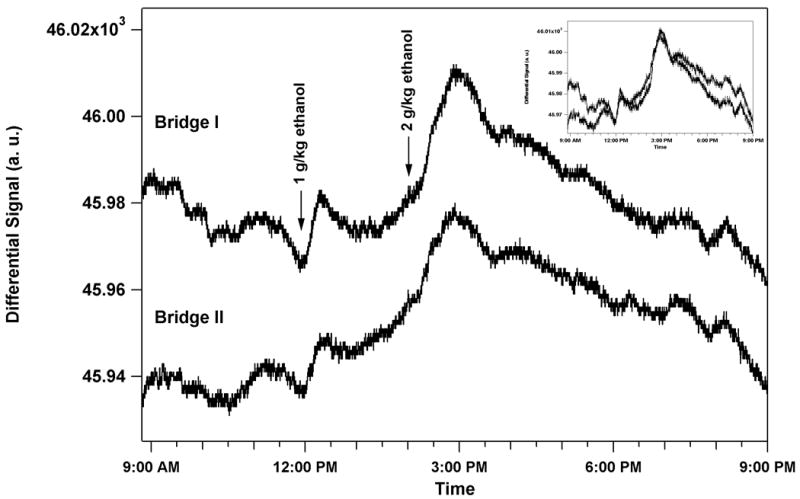
Fig. 4.

The left-hand axis shows sensor output versus time. An ethanol dose of 1 g/kg was given to the rat by IP injection at 11:56 AM, 3 h 44 min after surgical implantation. Immediately following the IP injection, the sensor signal had a positive slope and peaked 20 min. after injection. The signal gradually decreased as the alcohol was metabolized. A second ethanol dose of 2 g/kg ethanol was given by IP injection at 2:02 PM, 2 h 4 min after the first dose. The sensor signal peaked 55 min after the injection. The upper graph shows the sensor output from Bridge I while the lower graph shows the sensor output from Bridge II. Bridge II is offset so that both bridges could be plotted with the same scale. An inset shows the overlap of the two bridges.
