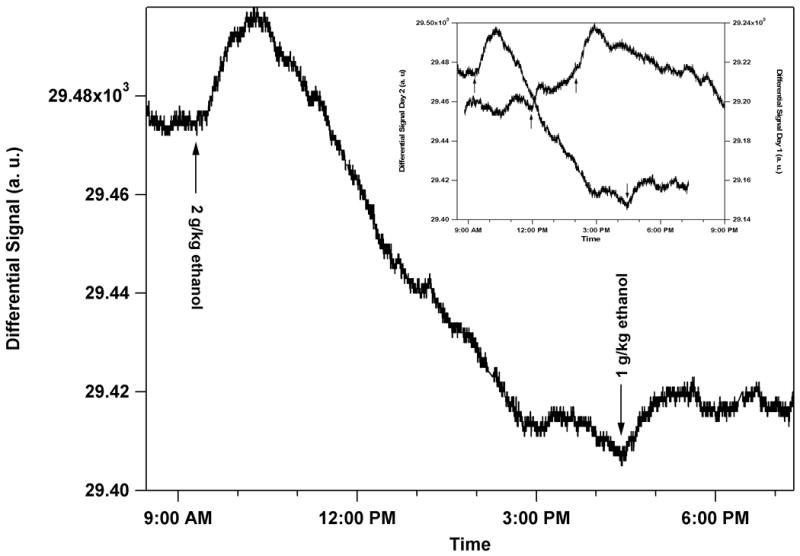
Fig. 5.

The left-hand axis shows sensor output versus time. An ethanol dose of 2 g/kg was given to the rat by IP injection at 9:24 AM the following morning after surgical implantation. Immediately following the IP injection, the sensor signal had a positive slope and peaked 56 min after injection. A second ethanol dose of 1 g/kg ethanol was given by IP injection at 4:34 PM. The sensor signal peaked 48 min after the injection. The graph shows the sensor output from Bridge II. An inset shows the overlap of Bridge II from Days 1 and 2 where the magnitude of the scales on both axis are the same. In this figure, no offsets are used.
