
Figure 2.
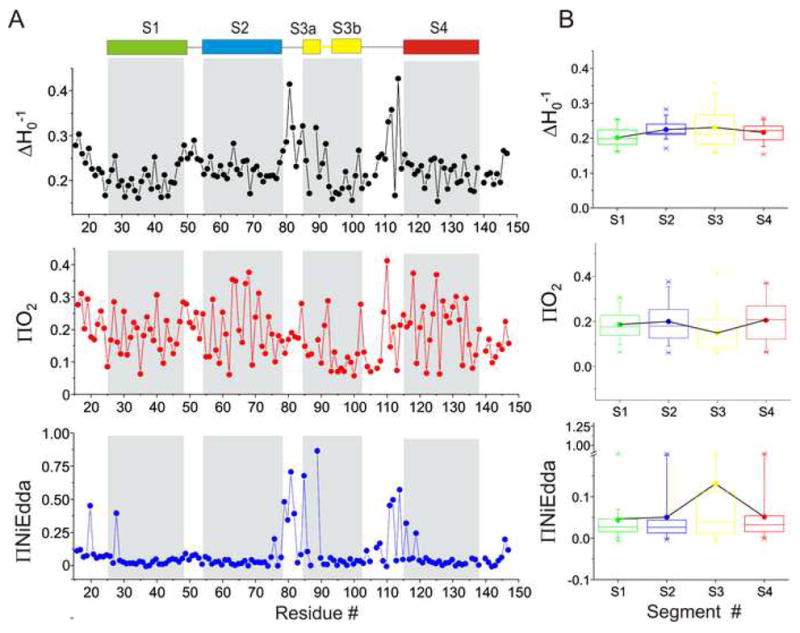
EPR based structural analysis of the isolated-VSD. (A) Mobility ΔHo−1(black), O2 accessibility ΠO2 (red) and NiEdda accessibility ΠNiEdda (blue). The gray regions represent the putative TM segments from the crystal structure. (B) The average mobility and accessibility parameters calculated for each of the TM segments. Each box denotes an individual TM segment with SDs marked as error bars.