
Figure 3.
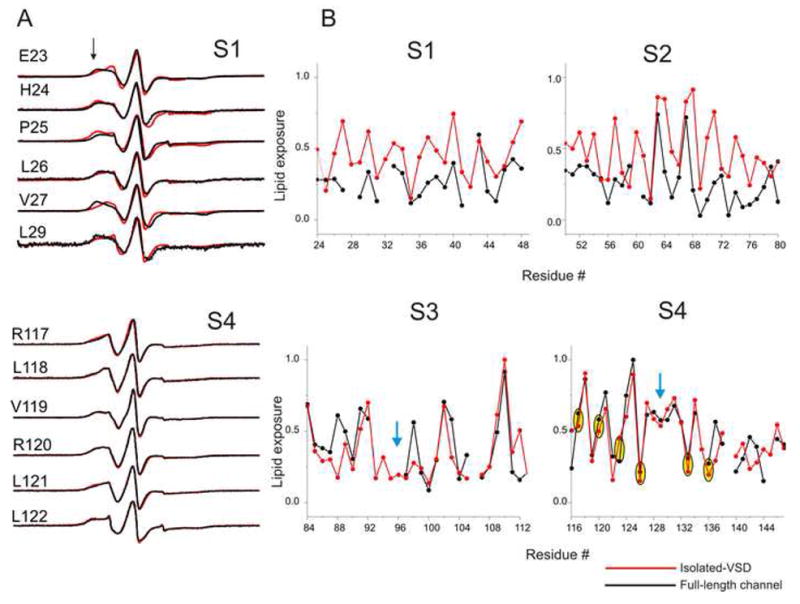
Comparison of the residue-specific enviromental parameters in the FL-channel and the isolated-VSD. (A) An overlap of representative X-band CW EPR spectra of spin-labeled mutants from the S1 and the S4 segments in the FL-channel (black) and the isolated-VSD (red). Black arrow-head shows the location of immobile component of the spectra. (B) Profile of changes in the ΠO2 parameters. The values were normalized to the maximum value measured within each data set. The blue arrow-head marks the break in the α-helical periodicity of the accessibility. Positions of the gating charges in S4 are highlighted by yellow ovals.