
Figure 6.
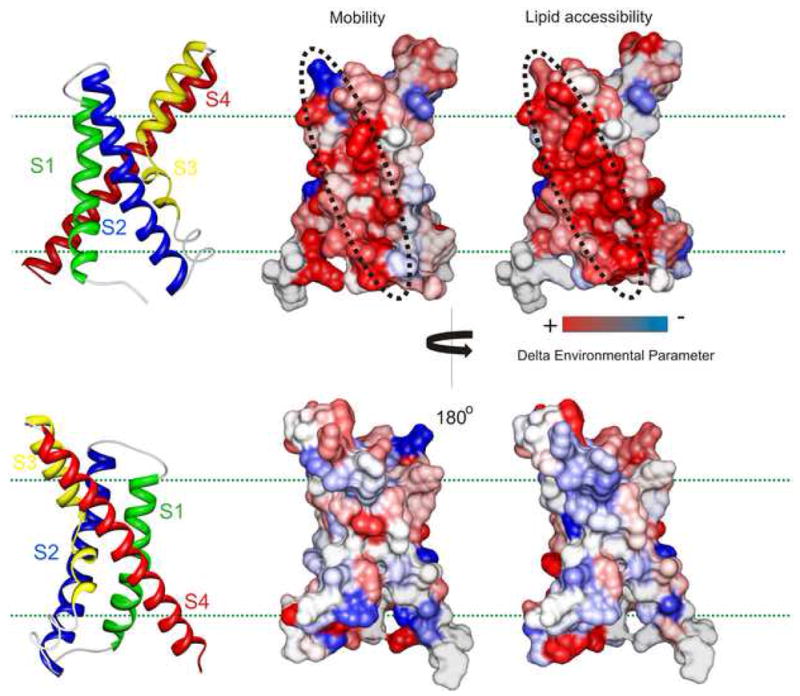
Mapping the molecular interacting surface of the VSD with the PD. Fractional differences in the mobility and ΠO2 measured in the corresponding residues in the isolated-VSD and in the full-channel mapped on the sensor structure and color coded with a gradient from red to blue. Red denotes increase and blue represents decrease in the environmental parameter. Dotted black line marks the surface of highest impact.