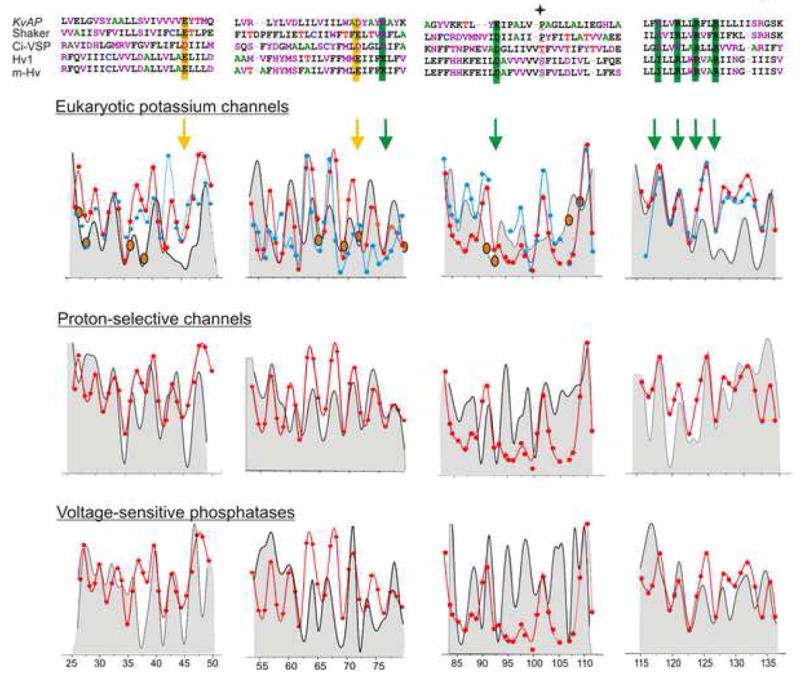
Figure 8.

Comparison of the sequence variability within the VSD in eukaryotic Kv channels, Hv channels and the VSP family. Sequence alignment of the TM segments comprising the VSD (Top). Filled star marks the position of the break in S3. An overlap of the calculated sequence variability at each position (grey background) and the corresponding normalized ΠO2 measured within the FL-channel (blue) and the isolated-VSD (red) of KvAP. Positions corresponding to charge residues are marked by arrows. Highly impacted residues in perturbation analyses in eukaryotic Kv channels are shown in orange circles.
