
Fig. 4.
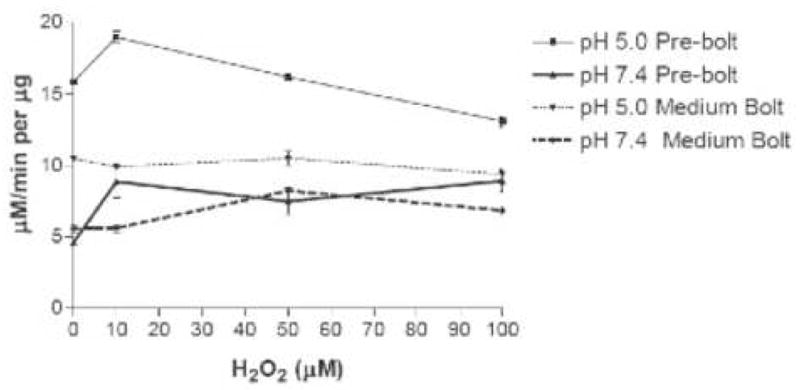
LOX specific activity following incubation of leaf extracts with hydrogen peroxide. Curves represent LOX activity after a 2-minute incubation with hydrogen peroxide at the indicated concentrations. LOX activity was measured at pH 5.0 (thin lines) or pH 7.4 (heavy lines). Error bars represent standard deviation in the data.